Background
Problem Statement
To educate consumers on the effective environmental and financial impact of their vehicle use.
Consumers do not have easy access to the data regarding the entire environmental and fiscal impact of their vehicle purchases.
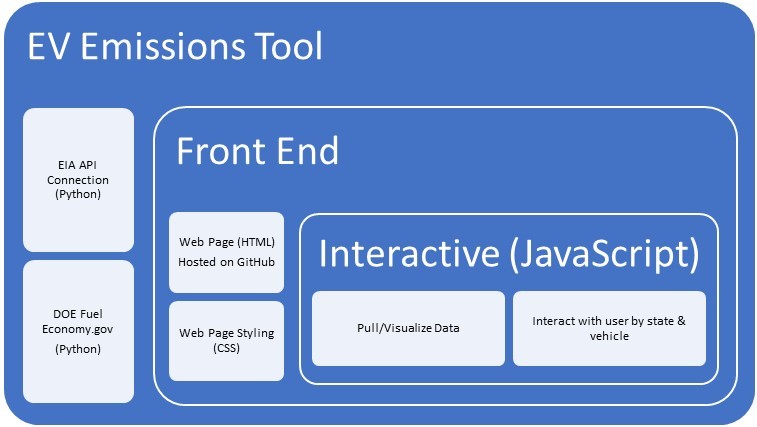
This tool will provide a single source, with easy to interoperate visualizations to provide consumers with all the information they need to decide on a purchase.
Literature Survey
[1] T. M. Mai, M. Hand, S. F. Baldwin, R. H. Wiser, G. L. Brinkman, P. Denholm, D. J. Arent, G. Porro, D. Sandor, D. J. Hostick, M. Milligan, E. A. DeMeo and M. Bazilian, "Renewable Electricity Futures for the United States," IEEE Transactions on Sustainable Energy, vol. 5, no. 2, pp. 372-378, 2014.
[2] K.-F. V. Wong and A. Aslani, "Analysis of renewable energy development to power generation in the United States," Renewable Energy, vol. 63, pp. 153-161, 2014.
[3] M. B. McElroy and X. Chen, "Wind and Solar Power in the United States: Status and Prospects," CSEE JOURNAL OF POWER AND ENERGY SYSTEMS, vol. 3, no. 1, pp. 1-6, 2017.
[4] E. A. Nanaki and C. J. Koroneos, "Comparative economic and environmental analysis of conventional, hybrid and electric vehicles - the case study of Greece," Journal of Cleaner Production - Elsevier, pp. 261-266, 2013.
[5] T. Lipman and A. Lajunen, "Lifecycle cost assessment and carbon dioxide emissions of diesel, natural gas, hybrid electric, fuel cell hybrid and electric transit buses," Energy - Elsevier, pp. 329-342, 2016.
[6] A. Elgowainy, J. Han, J. Ward, F. Joseck, D. Gohlke, A. Lindauer, T. Ramsden, M. Biddy, M. Alexander, S. Barnhart, I. Sutherland, L. Verduzco and T. J. Wallington, "Current and Future United States Light-Duty Vehicle Pathways: Cradle-to-Grave Lifecycle Greenhouse Gas Emissions and Economic Assessment," Environmental Science & Technology, pp. 2392-2399, 2018.
[7] N. C. Onat, M. Kucukvar and O. Tatari, "Conventional, hybrid, plug-in hybrid or electric vehicles? State-based comparative carbon and energy footprint analysis in the United States," Applied Energy, pp. 36-49, 2015.
[8] W. J. Smith, "Can EV (electric vehicles) address Ireland's CO2 emissions from transport?," Energy, vol. 35, pp. 4514-4521, 2010.
[9] P. Jochem, S. Babrowski and W. Fichtner, "Assessing CO2 emissions of electric vehicles in Germany in 2030," Transportation Research, vol. 78, no. A, pp. 68-83, 2014.
[10] N. Wilson, A. Maher, G. Thomson and M. Keall, "Vehicle emissions and consumer information in car advertisements," Environmental Health, pp. 7-14, 2008.
[11] B. Lane and S. Potter, "The adoption of cleaner vehicles in the UK: exploring the ocnsumer attitude-action gap," Journal of Cleaner Production, vol. 15, pp. 1085-1092, 2007.
[12] Y. A. B. F. L. M. Raykov, "What to Do When K-Means Clustering Fails: A SImple yet Principled Alternative Algorithm," PLOS ONE, p. 28, 2016.
[13] Y. W. B. C. C.-C. G. R. Xiong, "Electric Vehicle Driver CLustering using Statistical Model andf Machine Learning," p. 5, 2018.
[14] A. M. M. F. P. Jain, "Data CLustering: A Review," IEEE, p. 50, 1996.
[15] O. C. M. S. G. B. P. H. T. T. R. B. D. A. R. Troyanskaya, "Missing Value Estimation Methods for DNA Microarrays," Bioinformatics, p. 6, 2001.
